

From January to April in 2021, the country's total electricity consumption is 2.55.8 billion kWh, a year-on-year increase of 19.1%
- Categories:Industry Information
- Author:
- Origin:
- Time of issue:2021-05-17
- Views:0
(Summary description)
From January to April, the electricity consumption of the whole society continued to grow rapidly, and the electricity consumption of the whole society in all provinces maintained a positive growth; the growth rate of electricity consumption in the country's 13 provinces exceeded the national average; the electricity consumption of industry and manufacturing increased Speeds are higher than the average level of electricity consumption in the whole society; the combined electricity consumption growth rate of the four major high-load energy industries has increased year-on-year, but is lower than the industrial average.
1. The electricity consumption of the whole society
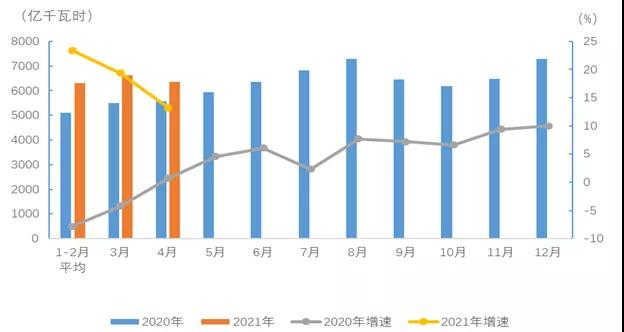
From January to April, the country’s electricity consumption was 2.5581 billion kWh, a year-on-year increase of 19.1%. Among them, the country’s electricity consumption in April was 636.1 billion kWh, a year-on-year increase of 13.2%.
Analyzed by industry①, from January to April, the power consumption of the primary industry was 28.3 billion kWh, a year-on-year increase of 23.8%; the power consumption of the secondary industry was 1,707.4 billion kWh, a year-on-year increase of 20.7%; the power consumption of the tertiary industry was 437.9 billion KWh, an increase of 29.0% year-on-year; the electricity consumption of urban and rural residents was 384.5 billion kWh, an increase of 3.8% year-on-year.
(Figure 1 Monthly electricity consumption and growth rate of the whole society in 2020 and 2021)
In April, the growth rate of electricity consumption in the primary, secondary and tertiary industries was 16.4%, 12.3% and 31.3% respectively; the electricity consumption of urban and rural residents decreased by 0.9% year-on-year.
2. Electricity consumption by region
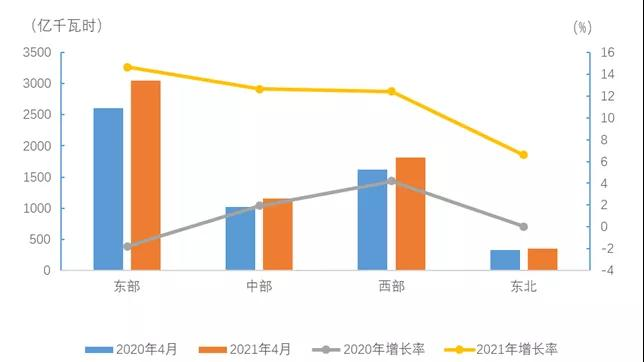
From January to April, the electricity consumption of the whole society in the eastern, central, western and northeastern regions was 11,871, 4,791, 7410, and 151 billion kWh, respectively, with growth rates of 21.8%, 19.8%, 16.6%, and 9.5%.
In April, the growth rate of electricity consumption in the eastern, central, western and northeastern regions was 14.7%, 12.6%, 12.4% and 6.6% respectively.
(Figure 2 Total electricity consumption and its growth rate in the current month by region)
From January to April, the growth rate of electricity consumption in the whole society in 13 provinces exceeded the national average. In order: Tibet (33.6%), Hubei (31.9%), Zhejiang (29.3%), Guangdong (29.2%), Yunnan (27.1%), Jiangxi (24.9%), Jiangsu (24.1%), Fujian (23.3%) , Guangxi (21.8%), Sichuan (21.8%), Chongqing (20.4%), Anhui (19.8%) and Shaanxi (19.4%).
In April, the growth rate of electricity consumption in 15 provinces exceeded the national average, followed by Tibet (27.5%), Guangdong (22.6%), Ningxia (22.0%), Hubei (20.0%), Hainan (19.6%) , Qinghai (19.3%), Yunnan (18.4%), Zhejiang (16.5%), Sichuan (16.3%), Fujian (16.1%), Jiangxi (15.6%), Jiangsu (15.1%), Guangxi (14.4%), Hebei (13.9%) and Shaanxi (13.6%); all provinces and the whole society have a positive growth in electricity consumption.
3. Electricity consumption in industry and manufacturing
From January to April, the national industrial electricity consumption was 1,675.7 billion kilowatt-hours, an increase of 20.5% year-on-year, and the growth rate was 26.6 percentage points higher than the same period last year, accounting for 65.5% of the total electricity consumption of the society. In April, the national industrial electricity consumption was 437.1 billion kWh, a year-on-year increase of 12.1%, and the growth rate was 10.7 percentage points higher than the same period last year, accounting for 68.7% of the total electricity consumption of the society.
From January to April, the nation’s manufacturing power consumption was 1,276.5 billion kWh, a year-on-year increase of 22.5%, and the growth rate was 29.0 percentage points higher than the same period last year. Among them, the total electricity consumption of the four high-load energy industries was 705.9 billion kwh, a year-on-year increase of 16.3%, and the growth rate was 19.4 percentage points higher than the same period last year; the high-tech and equipment manufacturing industry ③The electricity consumption was 267 billion kwh, a year-on-year increase 35.9%, the growth rate increased by 46.8% over the same period of the previous year; consumer goods manufacturing ④ electricity consumption was 165.2 billion kWh, a year-on-year increase of 27.5%, and the growth rate was 41.8% higher than the previous year; other manufacturing ⑤ industry electricity consumption 1385 Billion kilowatt-hours, an increase of 26.5% year-on-year, an increase of 32.9 percentage points over the previous year.
In April, the national manufacturing power consumption was 344.1 billion kWh, a year-on-year increase of 12.7%, and the growth rate was 12.6 percentage points higher than the same period last year; the average daily power consumption of the m
From January to April in 2021, the country's total electricity consumption is 2.55.8 billion kWh, a year-on-year increase of 19.1%
(Summary description)
From January to April, the electricity consumption of the whole society continued to grow rapidly, and the electricity consumption of the whole society in all provinces maintained a positive growth; the growth rate of electricity consumption in the country's 13 provinces exceeded the national average; the electricity consumption of industry and manufacturing increased Speeds are higher than the average level of electricity consumption in the whole society; the combined electricity consumption growth rate of the four major high-load energy industries has increased year-on-year, but is lower than the industrial average.
1. The electricity consumption of the whole society
From January to April, the country’s electricity consumption was 2.5581 billion kWh, a year-on-year increase of 19.1%. Among them, the country’s electricity consumption in April was 636.1 billion kWh, a year-on-year increase of 13.2%.
Analyzed by industry①, from January to April, the power consumption of the primary industry was 28.3 billion kWh, a year-on-year increase of 23.8%; the power consumption of the secondary industry was 1,707.4 billion kWh, a year-on-year increase of 20.7%; the power consumption of the tertiary industry was 437.9 billion KWh, an increase of 29.0% year-on-year; the electricity consumption of urban and rural residents was 384.5 billion kWh, an increase of 3.8% year-on-year.
(Figure 1 Monthly electricity consumption and growth rate of the whole society in 2020 and 2021)
In April, the growth rate of electricity consumption in the primary, secondary and tertiary industries was 16.4%, 12.3% and 31.3% respectively; the electricity consumption of urban and rural residents decreased by 0.9% year-on-year.
2. Electricity consumption by region
From January to April, the electricity consumption of the whole society in the eastern, central, western and northeastern regions was 11,871, 4,791, 7410, and 151 billion kWh, respectively, with growth rates of 21.8%, 19.8%, 16.6%, and 9.5%.
In April, the growth rate of electricity consumption in the eastern, central, western and northeastern regions was 14.7%, 12.6%, 12.4% and 6.6% respectively.
(Figure 2 Total electricity consumption and its growth rate in the current month by region)
From January to April, the growth rate of electricity consumption in the whole society in 13 provinces exceeded the national average. In order: Tibet (33.6%), Hubei (31.9%), Zhejiang (29.3%), Guangdong (29.2%), Yunnan (27.1%), Jiangxi (24.9%), Jiangsu (24.1%), Fujian (23.3%) , Guangxi (21.8%), Sichuan (21.8%), Chongqing (20.4%), Anhui (19.8%) and Shaanxi (19.4%).
In April, the growth rate of electricity consumption in 15 provinces exceeded the national average, followed by Tibet (27.5%), Guangdong (22.6%), Ningxia (22.0%), Hubei (20.0%), Hainan (19.6%) , Qinghai (19.3%), Yunnan (18.4%), Zhejiang (16.5%), Sichuan (16.3%), Fujian (16.1%), Jiangxi (15.6%), Jiangsu (15.1%), Guangxi (14.4%), Hebei (13.9%) and Shaanxi (13.6%); all provinces and the whole society have a positive growth in electricity consumption.
3. Electricity consumption in industry and manufacturing
From January to April, the national industrial electricity consumption was 1,675.7 billion kilowatt-hours, an increase of 20.5% year-on-year, and the growth rate was 26.6 percentage points higher than the same period last year, accounting for 65.5% of the total electricity consumption of the society. In April, the national industrial electricity consumption was 437.1 billion kWh, a year-on-year increase of 12.1%, and the growth rate was 10.7 percentage points higher than the same period last year, accounting for 68.7% of the total electricity consumption of the society.
From January to April, the nation’s manufacturing power consumption was 1,276.5 billion kWh, a year-on-year increase of 22.5%, and the growth rate was 29.0 percentage points higher than the same period last year. Among them, the total electricity consumption of the four high-load energy industries was 705.9 billion kwh, a year-on-year increase of 16.3%, and the growth rate was 19.4 percentage points higher than the same period last year; the high-tech and equipment manufacturing industry ③The electricity consumption was 267 billion kwh, a year-on-year increase 35.9%, the growth rate increased by 46.8% over the same period of the previous year; consumer goods manufacturing ④ electricity consumption was 165.2 billion kWh, a year-on-year increase of 27.5%, and the growth rate was 41.8% higher than the previous year; other manufacturing ⑤ industry electricity consumption 1385 Billion kilowatt-hours, an increase of 26.5% year-on-year, an increase of 32.9 percentage points over the previous year.
In April, the national manufacturing power consumption was 344.1 billion kWh, a year-on-year increase of 12.7%, and the growth rate was 12.6 percentage points higher than the same period last year; the average daily power consumption of the m
- Categories:Industry Information
- Author:
- Origin:
- Time of issue:2021-05-17
- Views:0
From January to April, the electricity consumption of the whole society continued to grow rapidly, and the electricity consumption of the whole society in all provinces maintained a positive growth; the growth rate of electricity consumption in the country's 13 provinces exceeded the national average; the electricity consumption of industry and manufacturing increased Speeds are higher than the average level of electricity consumption in the whole society; the combined electricity consumption growth rate of the four major high-load energy industries has increased year-on-year, but is lower than the industrial average.
1. The electricity consumption of the whole society
From January to April, the country’s electricity consumption was 2.5581 billion kWh, a year-on-year increase of 19.1%. Among them, the country’s electricity consumption in April was 636.1 billion kWh, a year-on-year increase of 13.2%.
Analyzed by industry①, from January to April, the power consumption of the primary industry was 28.3 billion kWh, a year-on-year increase of 23.8%; the power consumption of the secondary industry was 1,707.4 billion kWh, a year-on-year increase of 20.7%; the power consumption of the tertiary industry was 437.9 billion KWh, an increase of 29.0% year-on-year; the electricity consumption of urban and rural residents was 384.5 billion kWh, an increase of 3.8% year-on-year.
(Figure 1 Monthly electricity consumption and growth rate of the whole society in 2020 and 2021)
In April, the growth rate of electricity consumption in the primary, secondary and tertiary industries was 16.4%, 12.3% and 31.3% respectively; the electricity consumption of urban and rural residents decreased by 0.9% year-on-year.
2. Electricity consumption by region
From January to April, the electricity consumption of the whole society in the eastern, central, western and northeastern regions was 11,871, 4,791, 7410, and 151 billion kWh, respectively, with growth rates of 21.8%, 19.8%, 16.6%, and 9.5%.
In April, the growth rate of electricity consumption in the eastern, central, western and northeastern regions was 14.7%, 12.6%, 12.4% and 6.6% respectively.
(Figure 2 Total electricity consumption and its growth rate in the current month by region)
From January to April, the growth rate of electricity consumption in the whole society in 13 provinces exceeded the national average. In order: Tibet (33.6%), Hubei (31.9%), Zhejiang (29.3%), Guangdong (29.2%), Yunnan (27.1%), Jiangxi (24.9%), Jiangsu (24.1%), Fujian (23.3%) , Guangxi (21.8%), Sichuan (21.8%), Chongqing (20.4%), Anhui (19.8%) and Shaanxi (19.4%).
In April, the growth rate of electricity consumption in 15 provinces exceeded the national average, followed by Tibet (27.5%), Guangdong (22.6%), Ningxia (22.0%), Hubei (20.0%), Hainan (19.6%) , Qinghai (19.3%), Yunnan (18.4%), Zhejiang (16.5%), Sichuan (16.3%), Fujian (16.1%), Jiangxi (15.6%), Jiangsu (15.1%), Guangxi (14.4%), Hebei (13.9%) and Shaanxi (13.6%); all provinces and the whole society have a positive growth in electricity consumption.
3. Electricity consumption in industry and manufacturing
From January to April, the national industrial electricity consumption was 1,675.7 billion kilowatt-hours, an increase of 20.5% year-on-year, and the growth rate was 26.6 percentage points higher than the same period last year, accounting for 65.5% of the total electricity consumption of the society. In April, the national industrial electricity consumption was 437.1 billion kWh, a year-on-year increase of 12.1%, and the growth rate was 10.7 percentage points higher than the same period last year, accounting for 68.7% of the total electricity consumption of the society.
From January to April, the nation’s manufacturing power consumption was 1,276.5 billion kWh, a year-on-year increase of 22.5%, and the growth rate was 29.0 percentage points higher than the same period last year. Among them, the total electricity consumption of the four high-load energy industries was 705.9 billion kwh, a year-on-year increase of 16.3%, and the growth rate was 19.4 percentage points higher than the same period last year; the high-tech and equipment manufacturing industry ③The electricity consumption was 267 billion kwh, a year-on-year increase 35.9%, the growth rate increased by 46.8% over the same period of the previous year; consumer goods manufacturing ④ electricity consumption was 165.2 billion kWh, a year-on-year increase of 27.5%, and the growth rate was 41.8% higher than the previous year; other manufacturing ⑤ industry electricity consumption 1385 Billion kilowatt-hours, an increase of 26.5% year-on-year, an increase of 32.9 percentage points over the previous year.
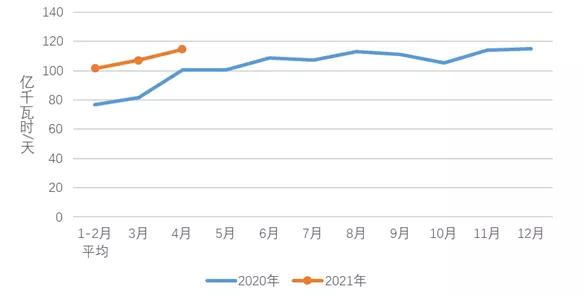
In April, the national manufacturing power consumption was 344.1 billion kWh, a year-on-year increase of 12.7%, and the growth rate was 12.6 percentage points higher than the same period last year; the average daily power consumption of the manufacturing industry was 11.47 billion kWh/day, an increase of 14.3 compared with the same period last year. 100 million kWh/day. Among them, the total electricity consumption of the four high-load energy industries was 186.9 billion kWh, a year-on-year increase of 10.0%, and the growth rate was 8.5 percentage points higher than the same period last year; the high-tech and equipment manufacturing industry consumed 73.5 billion kWh of electricity, an increase of 18.7 year-on-year %, the growth rate increased by 18.8 percentage points over the same period last year; the power consumption of consumer goods manufacturing was 46.2 billion kWh, an increase of 12.4% year-on-year, and the growth rate was 16.6 percentage points higher than the same period last year; the power consumption of other manufacturing industries was 37.5 billion kWh At that time, the year-on-year growth was 16.3%, and the growth rate was 16.7 percentage points higher than the same period last year.
(Figure 3 Monthly average daily electricity consumption of manufacturing in 2020 and 2021)
4. Electricity consumption in high-load energy industries
From January to April, the electricity consumption of the chemical industry was 161.6 billion kwh, a year-on-year increase of 12.3%, and the growth rate was 16.5 percentage points higher than the same period last year; the electricity consumption of the building materials industry was 118.2 billion kwh, a year-on-year increase of 30.6%, and the growth rate was higher than that of the previous year. A year-on-year increase of 43.2%; ferrous metal smelting industry power consumption was 206.9 billion kWh, a year-on-year increase of 19.4%, and the growth rate was 21.4 percentage points higher than the same period last year; non-ferrous metal smelting industry power consumption was 219.1 billion kWh, a year-on-year increase of 10.1 %, the growth rate increased by 8.3 percentage points over the same period last year.
In April, the electricity consumption of the chemical industry was 40.2 billion kWh, a year-on-year increase of 7.3%, and the growth rate was 7.1 percentage points higher than the same period last year; the electricity consumption of the building materials industry was 37.7 billion kWh, a year-on-year increase of 14.6%, and the growth rate was higher than the same period last year. An increase of 15.7 percentage points; the power consumption of the ferrous metal smelting industry was 53.9 billion kWh, a year-on-year increase of 15.1%, and the growth rate was 14.4 percentage points higher than the same period last year; the power consumption of the non-ferrous metal smelting industry was 55.2 billion kWh, a year-on-year increase of 4.4%, The growth rate dropped 0.4 percentage points from the same period last year.
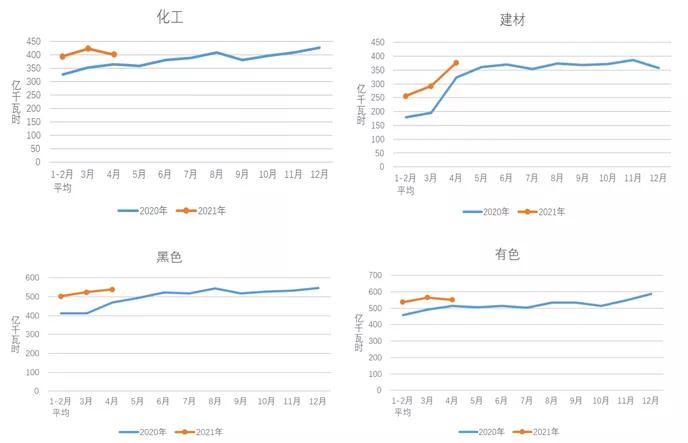
(Figure 4 Monthly electricity consumption of key industries in 2020 and 2021)
Note:
① Starting from May 2018, the division of the three industries has been adjusted in accordance with the "Notice of the National Bureau of Statistics on Revising the Regulations on the Division of the Three Industries (2012)" (Guo Tong Jie Guan Han [2018] No. 74). To ensure data comparability, the same period The data has been reclassified according to the new standard.
② The eastern region includes 10 provinces (cities) of Beijing, Tianjin, Hebei, Shanghai, Jiangsu, Zhejiang, Fujian, Shandong, Guangdong, and Hainan; the central region includes 6 provinces of Shanxi, Anhui, Jiangxi, Henan, Hubei, and Hunan; the western region Including 12 provinces (cities and autonomous regions) of Inner Mongolia, Guangxi, Chongqing, Sichuan, Guizhou, Yunnan, Tibet, Shaanxi, Gansu, Qinghai, Ningxia, and Xinjiang; Northeast China includes 3 provinces of Liaoning, Jilin and Heilongjiang.
③ High-tech and equipment manufacturing industries include: pharmaceutical manufacturing, metal products, general equipment manufacturing, special equipment manufacturing, automobile manufacturing, railway/ship/aerospace and other transportation equipment manufacturing, electrical machinery and equipment manufacturing , Computer/communication and other electronic equipment manufacturing, instrumentation manufacturing 9 industries.
④ Consumer goods manufacturing industry includes: agricultural and sideline food processing industry, food manufacturing industry, wine/beverage and refined tea manufacturing industry, tobacco product industry, textile industry, textile clothing/apparel industry, leather/fur/feather and its products and footwear industry , Wood processing and wood/bamboo/rattan/palm/grass products, furniture manufacturing, paper and paper products, printing and recording media reproduction, culture, education, arts and crafts/sports and entertainment products manufacturing industries.
⑤ Other manufacturing industries are classified into 31 industries for manufacturing electricity, except for the four high-load energy industries, high-tech and equipment manufacturing industries, and consumer goods industries, including: petroleum/coal and other fuel processing industries, Six industries include chemical fiber manufacturing, rubber and plastic products, other manufacturing, comprehensive utilization of waste resources, and metal products/machinery and equipment repair.
Scan the QR code to read on your phone

Copyright © 2021 Shandong SINOUN Electric Co., Ltd. All rights reserved
鲁ICP备2021038506号-1 国际站建设:中企动力 淄博 外贸谷歌推广


What can I help you?


sdzldq@126.com

No. 19, Wangxu Road, North District, Economic Development Zone, Huantai, Zibo, Shandong